Your current location: home > Exhibition Hall Online Venue Layout N2 Chongqing Tran sportation Development & lnvestment Group Chongqing Public Transport Hol...
Stations
Stations: Cover the data of all operating stations of the public transport group. Display the geographical distribution of the stations. Analyze the operational index data such as passenger flow, shifts, and passengers per shift within a custom period. Provide the station passenger flow, shifts, the top rankings of congested stations, as well as station heat maps to analyze high-traffic sites.
Lines
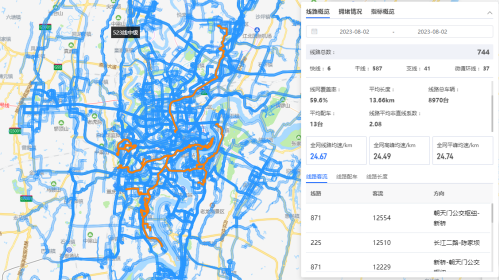
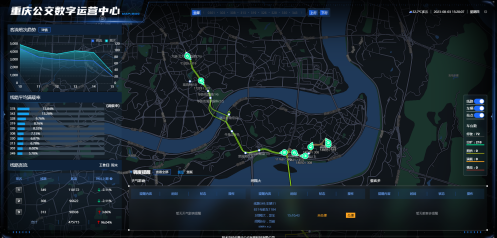
Lines: Cover all conventional line data of the public transport group. Check the network distribution and direction of the lines. Analyze the number of various types of lines, line length, road network length, network density, bus allocation, line network operating speed, non-linear coefficient, etc. Provide the line’s passenger flow, bus allocation and the top ranking of vehicle lineup. Analyze the lines’ data on passenger-flow trend of different periods, lines’ congestion situation, road congestion situation, average daily passenger flow, average daily shifts’ frequency, the number of passenger per kilometer and per vehicle-day, and frequency interval, carrying kilometers, line revenue, and other operational indicators.
Vehicles
Vehicles: Aggregates the data of all operating vehicles under public transport group to view the operation data of various types of vehicles, the real-time location of the vehicles. Access the vehicle video that is being monitored, as well as the basic information about the drivers, shifts, driving distances, and pre- and post-safety inspections. Conduct the statistical analysis of driving habits. Analyze the distances between the vehicle and POIs like stations, charging stations, fueling stations, repair stations, etc. as well as the distances between the front and rear shuttle buses.
Passenger flow
Passenger flow: Create a passenger flow corridor by superimposing the passenger flow data of each line on the map. The passenger flow density of the road transport is reflected in the weight of the passenger-flow-corridor lines. Provide passenger flow, shifts frequency, proportion, passengers per kilometers and per vehicle-day in a custom period and related statistical analysis. Provide graphs showing the trends in passenger traffic for various transit cards. Offer four different types of OD analysis tools: passenger traffic site, line, area, and custom ODs. Analyze cross-river Passenger flow and year-on-year increase through cross-river passenger flow analysis. Provide a passenger flow early warning system, and keep track of passenger flow, shifts frequency, and passengers per vehicle-day when the data significantly fluctuates. Provide a heat map of the passenger flow and assess which regions have a high density of bus traffic and how the passenger flow varies over time.
Weather
Weather: Provide the real-time and the next 12-hour weather data of each administrative district of the main city, including temperature, visibility, rainfall, and wind. Realized the disastrous weather warning function. When there is severe weather, the warning notice will pop up on the map. Realized 1KM*1KM grid weather thermal data analysis. Offer custom settings for weather thermal thresholds to specify the thermal thresholds of rainfall, temperature, wind, and visibility. The thermal grids will be shown after the threshold has been met. Click on any thermal grid to view the affected lines impacted by weather. Provide labeling and management of pitfall-prevention and control sites, mark hazards sites like flood, ice and snow, heavy fog, etc. at any location on the map. Send the warning push early to safety managers to take preventive measures in advance combined with weather data.
Route planning
Route planning: According to the route planning algorithm, set the start and end points and waypoints in the map to plan the passable route automatically and build the lines according to the planned route direction. Carry out technical analysis on newly planned routes, provide basic attributes of roads, repeat route analysis, and predict revenue, passenger flow, cross-section passenger flow, turnover rate, and passenger flow conversion rate of newly opened lines. Predict of passenger flow impact on other routes nearby after the new line is opened. Offer the population data along the routes. Automatically generate a line technical analysis report including bus stations, hospitals, schools, night parking lots, etc., and finally generate after the POI information processing.
Other displays


The large screen for real-time monitoring of lines schedule was developed for dispatchers. They can view the direction, stations, and vehicles of these lines on the map. To offer reference data for dispatching work, stations statistical analysis of real-time passenger flow, vehicle utilization rate, line load and passenger flow change of shifts, together with early warning of catastrophic weather and reminders of long shifts’ gaps, were incorporated.